
Are Home Prices Rising or Falling in Pleasant View, TN?
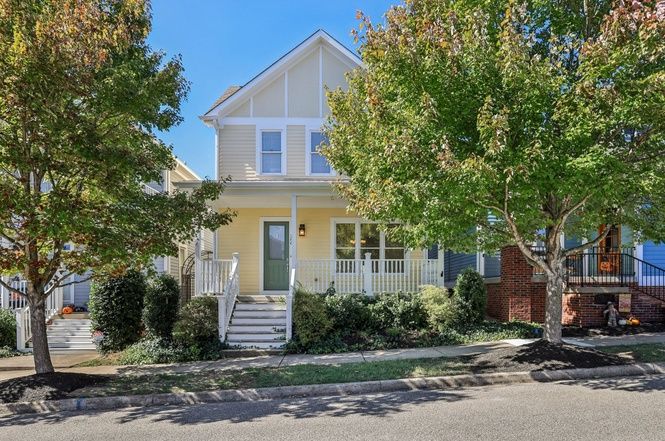
Pleasant View, a city near Nashville, TN, has seen prices fall nearly 9% from last year, one of the steeper declines among Nashville-area suburbs. Here's what's driving it and what it means for buyers and sellers.
The National Picture
Across the country, prices continue to climb at a modest pace. The national median hit $398,596 in the 3 months ending August 2026, up 2% year over year. But affordability has quietly improved: the typical household earns about $87,599 and spends around 34% of income on housing, down from 36% a year ago. About 20% of listings carry a price cut, there are 4 months of supply, and homes take a median of 50 days to sell.
Home Prices in the Nashville Area
The Nashville metro median stands at roughly $480,000, essentially unchanged year over year. Metro-area households earn a median of about $96,448 and direct around 36.3% of that toward housing. Pleasant View, priced just below that metro median, has become relatively more affordable compared to where it stood a year ago.
Steep Price Drops Create Buyer Opportunity
Pleasant View's median sale price dropped 9% from a year ago to $410,718, a savings of roughly $39,000 compared to last year. Almost 44% of listings have had a price reduction, and homes sit on the market for a median of 111 days. Only about 5% of sales closed above list, with the typical sale at 98% of asking. By contrast, Clarksville saw a milder 1% dip, and Portland managed a 3% increase.
Why Are Prices Falling in Pleasant View?
A sharp pullback in new supply has not been enough to prop up prices. New listings fell about 16% from last year, and active inventory dropped 14%. But demand has been essentially flat — pending sales were barely changed year over year. With 4.5 months of supply, homes sitting over three months on market, and almost half of listings reduced, sellers have had to cut prices significantly to attract offers.
| City | Median Price | Price YoY | Price Drops | Months of Supply |
|---|---|---|---|---|
| Pleasant View ★ | $410,718 | -8.7% | 43.5% | 4.5 |
| Clarksville | $311,794 | -1.3% | 32.9% | 4.3 |
| White House | $389,642 | -0.1% | 30.7% | 4.3 |
| Goodlettsville | $398,236 | -0.9% | 39.9% | 4.6 |
| Portland | $329,772 | +3.1% | 29.7% | 4.9 |
| Columbia | $368,006 | -1.1% | 40.1% | 4.7 |
Limited to cities with at least 10 home sales in the period.
All data comes from Redfin and represents a 3 months ending August 2026. This article has been generated, in whole or in part, using generative artificial intelligence (AI) technology, with input from Redfin head of economics research Chen Zhao. While efforts have been made to ensure the accuracy and reliability of this information, you should independently verify all data, facts, and citations contained in this article before relying on it for any purpose. This information is not a substitute for advice from a real estate agent, financial advisor, or other licensed professional. Check the Redfin Data Center for additional in-depth housing market data.
Categories
Recent Posts





Redfin Principal Agent License ID: KY #291956, TN #348420
+1(615) 689-4654 | jennifer.bowers@redfin.com