
How Competitive is the Clarksville, TN Housing Market?
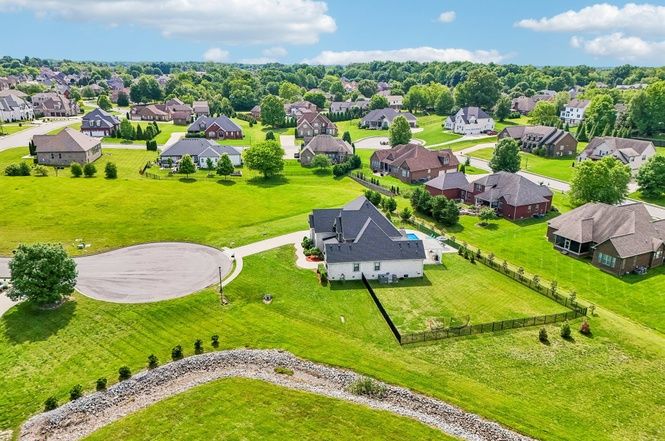
Clarksville, a city near Nashville, TN, is a moderately competitive housing market. About 16% of homes sold above list price in the 3 months ending June 2026—up 2.5 percentage points from a year ago—and the city is the Nashville metro's largest by sales volume.
The National Picture
Clarksville's 98.6% sale-to-list ratio exceeds the national 98.3%, and its sold-above rate of 15.9% is rising. But at 74 days on market, nearly 50% longer than the national median of 50, the city's pace is distinctly slow for a market where overbidding is gaining ground. Buyers have time, even as sellers gain a bit more leverage.
Neighborhood-Level Competition Is Uneven
Madison Street sees 18.1% of homes sell above asking with just 57 days on market, the fastest neighborhood in Clarksville. Meanwhile, Ringgold (10.7%, 120 days) and Greenwood (8.7%, 111 days) are far slower markets where bidding above asking is rare. Kenwood homes sell in 53 days but none went above list price, indicating quick sales at or below asking. Buyers should target their neighborhood based on how much competition they're willing to accept.
Why is Clarksville Moderately Competitive?
Clarksville is moderately competitive because flat pricing and broad affordability sustain a large buyer pool without creating acute scarcity. Prices held flat year over year at $315,000, keeping affordability intact and the buyer pool broad. Active listings rose only 1% to 2,442 while pending sales held essentially steady (-0.3%), maintaining the balance at 4.4 months of supply. The 2.5-point increase in overbidding came not from tightening supply but from 975 transactions generating enough buyer overlap on popular listings to push some above asking. Only 28% of listings carry price drops, one of the lowest rates in the metro.
Nearby Neighborhoods
| Neighborhood | Sold Above List | Sale-to-List | Days on Market | Off Market in 2 Wks |
|---|---|---|---|---|
| Clarksville | 15.9% | 98.6% | 74 days | 28.0% |
| Ringgold | 10.7% | 98.4% | 120 days | 37.0% |
| Greenwood | 8.7% | 99.0% | 111 days | 20.6% |
| Madison Street | 18.1% | 96.8% | 57 days | 23.2% |
| Kenwood | 0.0% | 99.6% | 53 days | 26.9% |
| Madison | 15.8% | 98.5% | 52 days | 42.2% |
Limited to neighborhoods with at least 10 home sales in the period.
All data comes from Redfin and represents a three-month rolling average ending June 2026. This article has been generated, in whole or in part, using generative artificial intelligence (AI) technology, with input from Redfin head of economics research Chen Zhao. While efforts have been made to ensure the accuracy and reliability of this information, you should independently verify all data, facts, and citations contained in this article before relying on it for any purpose. This information is not a substitute for advice from a real estate agent, financial advisor, or other licensed professional. Check the Redfin Data Center for additional in-depth housing market data.
Categories
Recent Posts





Redfin Principal Agent License ID: KY #291956, TN #348420
+1(615) 689-4654 | jennifer.bowers@redfin.com