
How Competitive is the Pleasant View, TN Housing Market?
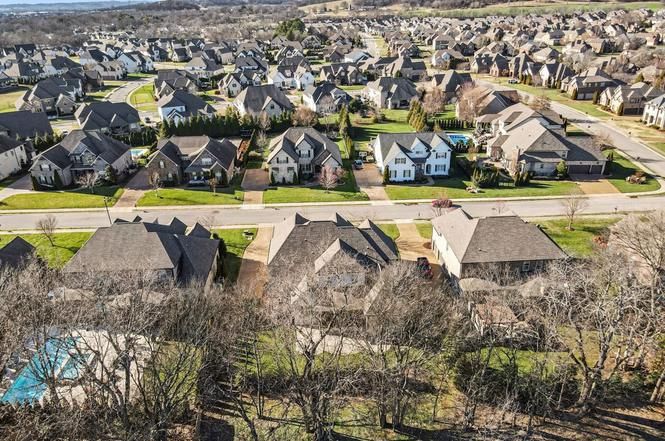
Pleasant View, a city near Nashville, TN, isn't a very competitive housing market. Only about 7% of homes sold above list price in the 3 months ending June 2026—down 8 percentage points from a year ago.
The National Picture
Pleasant View's 7.3% sold-above rate is less than a third of the national 24.6%, and just 20% of listings go under contract within two weeks versus 30.4% nationally. Yet its 99.2% sale-to-list ratio exceeds the national 98.3%, an unusual pairing that suggests sellers price accurately and get their asking price even though bidding above asking is exceptionally rare.
Few Bidding Wars Despite Full-Price Sales
Pleasant View's near-99% sale-to-list combined with sub-8% overbidding creates a distinctive profile: sellers get what they ask for but almost never more. This contrasts sharply with Parkwood-Union Hill in Nashville, where 21.5% sell above asking, or East Nashville at 15.8%. For buyers, Pleasant View offers predictability; you'll likely pay close to list price, but you won't be outbid by competing offers.
Why Isn't Pleasant View Very Competitive?
Pleasant View isn't very competitive because demand has collapsed faster than supply, leaving the market with minimal transaction activity. Active listings fell 17% to 105 and pending sales dropped 28%, demand cratered faster than supply shrank. Only 42 homes sold (-9% YoY), giving Pleasant View minimal transaction volume. At 5 months of supply and 78 days on market (down 14 from last year), the market has loosened meaningfully. The 8-point drop in overbidding reflects fewer buyers willing to stretch above asking in a small, less liquid market.
Nearby Neighborhoods
| Neighborhood | Sold Above List | Sale-to-List | Days on Market | Off Market in 2 Wks |
|---|---|---|---|---|
| Pleasant View | 7.3% | 99.2% | 78 days | 19.8% |
| Madison | 15.8% | 98.5% | 52 days | 42.2% |
| Bordeaux-Whites Creek-Haynes Trinity | 15.4% | 96.3% | 94 days | 22.2% |
| Donelson-Hermitage-Old Hickory | 16.7% | 98.0% | 59 days | 28.8% |
| East Nashville | 15.8% | 98.1% | 54 days | 37.0% |
| Parkwood-Union Hill | 21.5% | 98.2% | 66 days | 28.8% |
Limited to neighborhoods with at least 10 home sales in the period.
All data comes from Redfin and represents a three-month rolling average ending June 2026. This article has been generated, in whole or in part, using generative artificial intelligence (AI) technology, with input from Redfin head of economics research Chen Zhao. While efforts have been made to ensure the accuracy and reliability of this information, you should independently verify all data, facts, and citations contained in this article before relying on it for any purpose. This information is not a substitute for advice from a real estate agent, financial advisor, or other licensed professional. Check the Redfin Data Center for additional in-depth housing market data.
Categories
Recent Posts





Redfin Principal Agent License ID: KY #291956, TN #348420
+1(615) 689-4654 | jennifer.bowers@redfin.com